![Copy of STATIC 1.png]](https://help.aptimyz.com/hs-fs/hubfs/Copy%20of%20STATIC%201.png?height=50&name=Copy%20of%20STATIC%201.png)
The Transactions Report can be used as an end of day report to show all transactions across a date range.
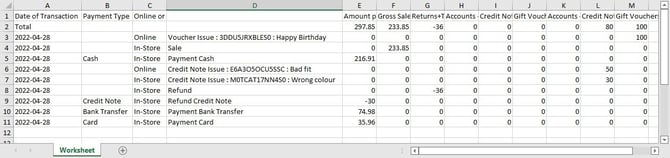
The core data for the transaction report is Transaction Amount Paid.
Amount paid includes all transactions at the till in whichever tender they were completed.
Amount paid also includes any payment for non-sales goods, e.g. the sale of Gift Cards
Creating a standard Transaction Report to be run daily/weekly/monthly
- Log into the Aptimyz back office with your login and password
- Select Reports / Transactions
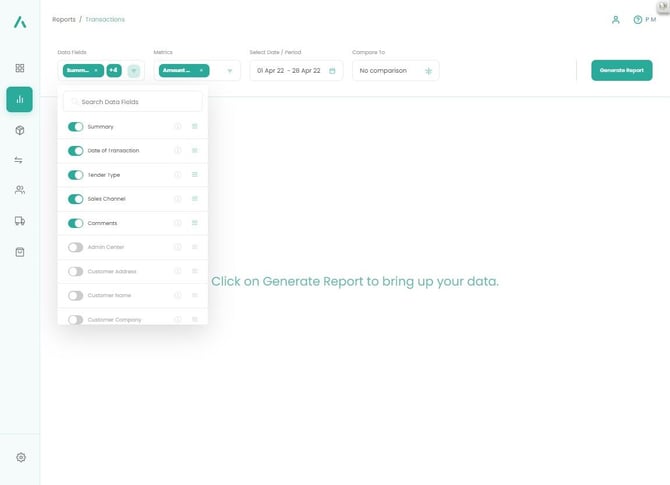
- Click on the down arrow in the Data Fields selector box
- Select the Data fields you wish to see in your report
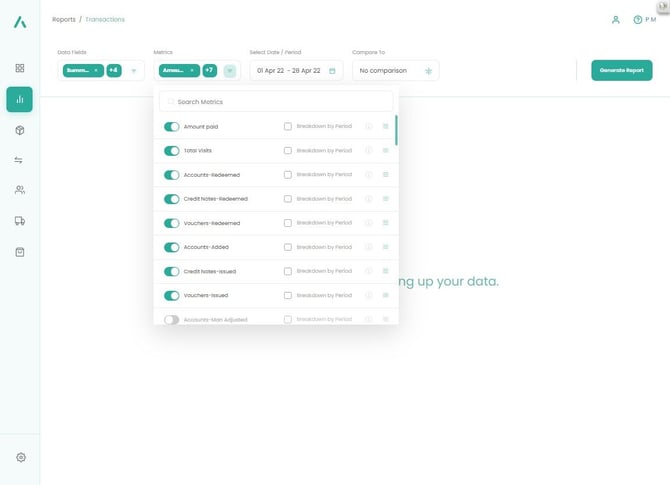
5. Click on the down arrow in the Metrics Selector box
6. Select the metrics you wish to see in your report
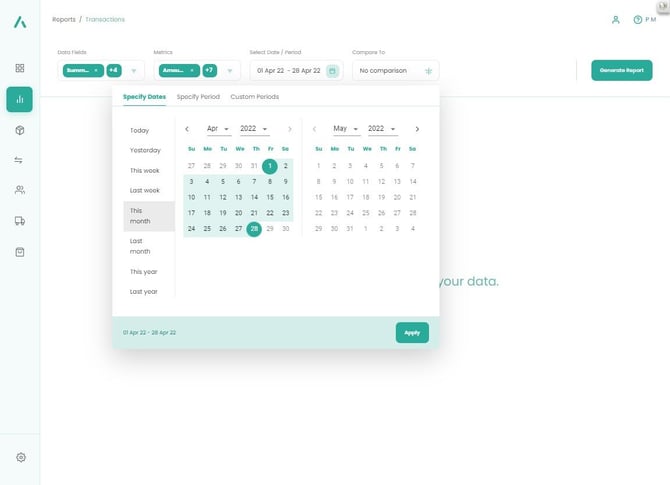
7. Click on the Select Date/Period to select the day or date range you wish to run the report over
8. When you have arranged your fields in the order you wish them to appear on your report, click on Generate Report.
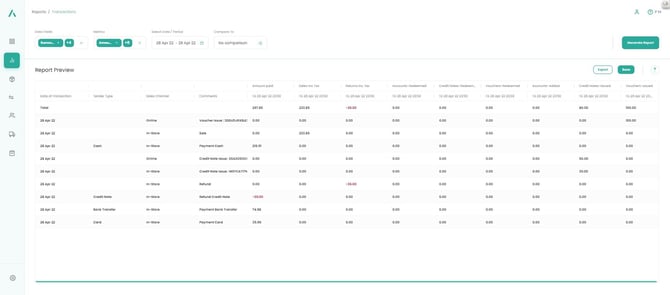
9. Once the report is displayed on the page, if it is a report you plan to use often, click on Save and Save it to a meaningful name.
10. The report can be exported to an Excel spreadsheet, for further analysis
11. The Saved report can be run from My Reports on an ad-hoc basis, just select the Green Triangle icon and change the dates, if required.
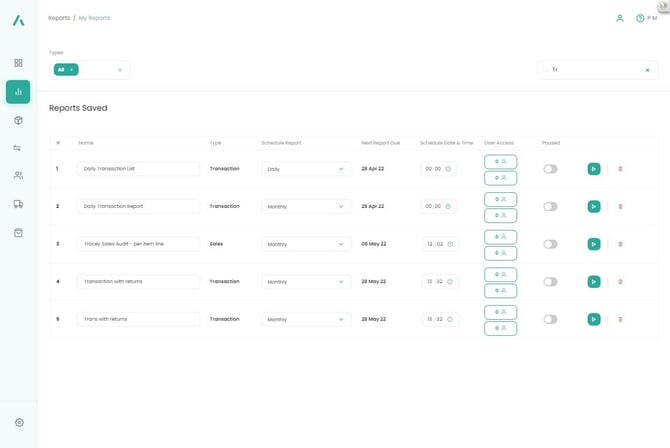
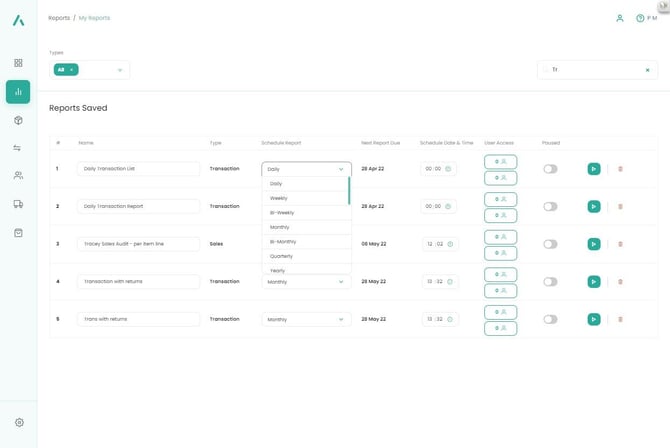
12. Alternatively, you can set any saved report to be run automatically by setting the Schedule Report setting to the desired timeframe.
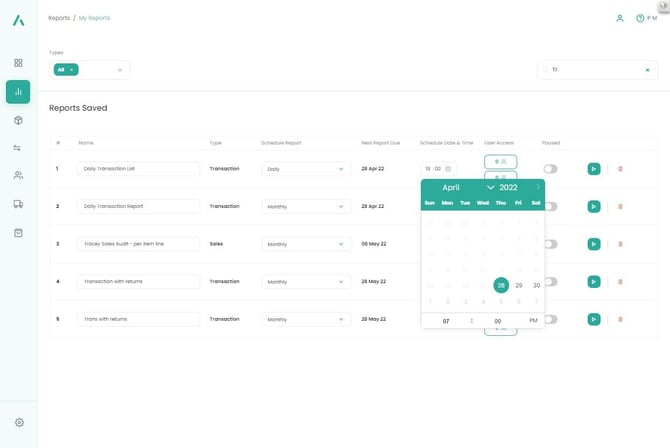
13. Set the Schedule Date & Time to the time you want the automated report to be run.
14. Add other Aptimyz users or even external email addresses to a list of users/recipients who will receive the automated reports (particularly useful for month end reports, run for external accounting professionals)
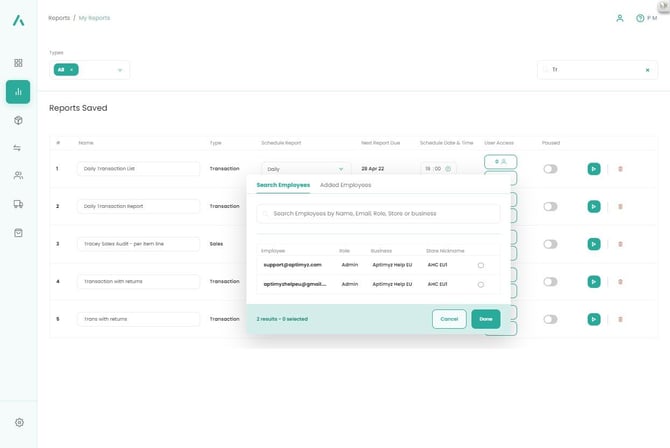
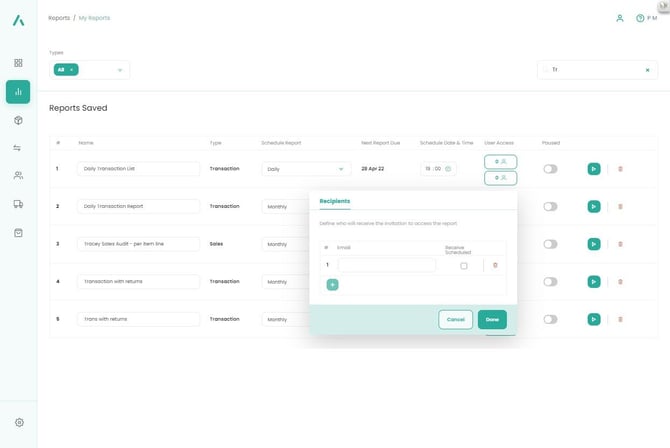
15. The system will then run the report automatically at the set intervals and will email it to the user logged in, plus any others added to the recipient list.
Data Fields
- Summary: Summary of metrics
- Admin Centre: Analysis of the different cost centres within a business
- Comments: This gives a brief description of the type of transaction e,g, Payment Card, Refund Card, Online Sale, etc
- Customer Options, Name, Address, etc: Analysis of metrics on a per customer basis
- Date/Time Sold: Combined Date and Time of Transaction
- Date: Date of Transaction
- Device: Analysis of the terminals across the business
- Sales Channel: Describes whether a sale is made on-line, in-store or by click and collect
- Store/Outlet: Analysis of metrics by store / outlet
- Online Order No.: The transaction number given to an online order by the website, this is then transferred to Aptimyz
- Tender Type: Describes how a sale was purchased – cash, credit card etc
- Time: Time of Transaction
- Transaction Detail: This gives a brief description of the type of transaction e,g, Payment Card, Refund Card, Online Sale, etc
- User: Analysis of metrics according to users of Aptimyz. i.e. revenue generated by each employee
Note: Not all drop down options will be available to all users. The permissions set will determine which drop down options are available, as well as restricting a user to certain data i.e. an employee for a particular store may only be able to access data relevant to that store.
Metrics
Note: Not all metrics can be used simultaneously.
-
Amount paid
-
Accounts-Added
-
Accounts-Man Adjusted
-
Accounts-Redeemed
-
Ave Amount Paid per Transaction
-
Ave Gross Profit per Transaction
-
Ave Transactions Count per Day
-
Credit Notes-Issued
-
Credit Notes-Redeemed
-
Discount Amt
-
Discount %
-
Vouchers-Issued
-
Vouchers- Redeemed
-
Gross Profit
-
Gross Profit %
-
Sales Inc Tax
-
Points Generated
-
Points-Man Adjusted
-
Points-Redeemed
-
Sales ex Tax
-
Refunds Issued-Qty
-
Refund-Tax
-
Refund-Ex Tax
-
Returned-Net
-
Returned-Tax
-
Items-Returned
-
Returns Inc Tax
-
Sales Tax
-
Sales-Units
-
Total Visits
Date Ranges
There are three date range options in the Aptimyz Report Generator
-
- A Date range: The metrics will provide the totals between two selected dates i.e. a selection of today’s date and the first Saturday of last Month will show all of the Revenue generated in that period
- By specific period:
a). A user selects the date to which they wish for the data to be analysed to i.e. today’s date or a date prior to today.
b). A user can select one of the following options to analyse the data including the number of periods they wish to analyse:
i. Year
ii. Quarter
iii. Month
iv. Week
v. Day
vi. Hour
c). A user stipulates the number of periods they would like to analyse i.e. last 4 years, last 52 weeks, last 12 hours etc from the date selected.
Note: Each period is presented as a single column i.e. if 12 hours is selected, there are 12 individual columns plus a total column.
Comparison Options
Users have the ability to compare the metric to a previous period.
When one selects Comparison, you are presented with two options:
- No comparison (the default option)
- Previous period comparison - this represents a metric total for a period equal to the dates originally selected based on an option of a previous period. In addition, a user can select up to 5 previous period comparisons for the report to perform i.e. if a user selected ‘Nett Sales’ as the metric and choose the Christmas trading period – 1st November 2020 to 24th December 2020, and choose to compare to the previous 3 years, the report would contain one column representing the Nett Sales generated for the period selected, plus a additional 3 columns showing the Nett Sales generated in each of the three previous years for that period
- Within the ‘Previous Period Comparison’ option, a user should have the ability to add further analysis including the option to see the difference between each comparison column whether through amounts or percentage i.e. in the above example, if a user also clicks on ‘% difference’, a further 2 columns would be added which would be between each comparison total column showing the % increase / decrease on revenue between each of the periods.